Water Quality/Aquarium Maintenance Observations
Students should be regularly observing and recording information about their aquarium.
- This Google-sheets "Online Aquarium Monitoring" form allows us (and you) to monitor water quality and aquarium issues throughout our network of schools. You'll find a page already set up for your school/classroom.
- This Paper Aquarium Data Tracking Sheet Template can be donwloaded and printed, so you can add it to an aquarium notebook.
As always, more data and information is available in the "Trout in the Classroom" GoogleSpace.
In Addition to Water Quality Monitoring, students may generate several sets of data each year, as the result of scientific journaling and experiments. These data may be used by incoming classes for scientific inquiry and math-skills building. (Additional data is available, upon request from the program coordinator!)
Data-Generating Experiments & Activities
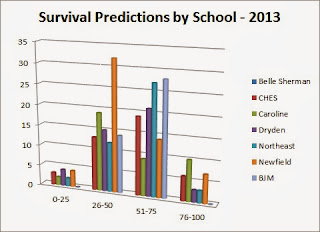
1. Fall Intro - Poll of Survival Expectations
Each fall, as they observe trout eggs hatching, students are asked to estimate the number of individuals that will survive to be released to streams in the spring. Students are encouraged to think about the changes and challenges that will confront their young trout, and these expectations may be revisited throughout the year. Here are results for the year (so far), along with previous years:


2. LIVE FOOD EXPERIMENT (January - February, 2011)
At this point in the year, under natural stream conditions, our trout would begin to feed on small insects and crustaceans. Can the same be said for our captive trout, conditioned to eat powdered fish food? For this experiment, small groups of students isolate one trout, and observe its reaction when 10-20 DAPHNIA- a tiny crustacean typically found in fresh water systems- are introduced.
Below are some high-light charts of this experiment from spring 2011. Complete datasets in excel may be found HERE (NEW!)
Here are the fall 2010 predictions...

2009 - 2010 Trout in the Classroom ACTUAL Survival Results

Fall 2009 Predictions for the 2009-2010 school year....
 From November, 2008 Results: 170 STUDENTS WHO RESPONDED from 6 schools.

Data-Generating Experiments & Activities
1. Fall Intro - Poll of Survival Expectations
Each fall, as they observe trout eggs hatching, students are asked to estimate the number of individuals that will survive to be released to streams in the spring. Students are encouraged to think about the changes and challenges that will confront their young trout, and these expectations may be revisited throughout the year. Here are results for the year (so far), along with previous years:


 |
| A summation of all students participating in the poll. |

School-by-school analysis: While expectations between schools are reasonably consistent, there are certainly differences in expectations. Why? One factor may be survival rates for prior classes at each school. Here are ACTUAL survival results from May/June 2011. Additional expectations
and survival data are located at the bottom of this page.

2. LIVE FOOD EXPERIMENT (January - February, 2011)
At this point in the year, under natural stream conditions, our trout would begin to feed on small insects and crustaceans. Can the same be said for our captive trout, conditioned to eat powdered fish food? For this experiment, small groups of students isolate one trout, and observe its reaction when 10-20 DAPHNIA- a tiny crustacean typically found in fresh water systems- are introduced.
Below are some high-light charts of this experiment from spring 2011. Complete datasets in excel may be found HERE (NEW!)
 |
| Chart 1. This chart compares the combined results of multiple tests at four schools. The feeding responses vary greatly during the first two minutes. Note that Newfield and Groton trout averaged roughly 1 inch in length, while South Hill and Boynton trout had grown significantly larger. |
 |
| Chart 2. This chart shows each of 13 individual experimental trials completed by Newfield Middle School 7th graders. Each plot line indicates the total number of daphnia consumed by a subject trout. |
 |
| Chart 3. There are many ways to manipulate the data generated by this experiment. Here, the total number of daphnia consumed during all trials is aggregated for two schools. Notably, the trout fry at Newfield were rouhly 1 inch in length, while those at South Hill for 1.5 inches, on average. Size and development may play a role in behavior. |
TROUT SURVIVAL RATES & EXPECTATIONS - Prior years.
Here are the fall 2010 predictions...
2009 - 2010 Trout in the Classroom ACTUAL Survival Results

Fall 2009 Predictions for the 2009-2010 school year....
